Analytics reports
MuninX reports summarize ticket volume, current workload, and reply and resolution speed.
Choose a reporting period
Section titled “Choose a reporting period”The Reports page supports:
- Last 7 days.
- Last 30 days.
- Last 90 days.
- Last year.
For most report cards and charts, the period selects tickets by their creation date. The report then uses each selected ticket’s latest status, priority, assignee, and measured performance values.
For example, Solved Tickets for the last 30 days means tickets created during those 30 days that are currently solved. It does not necessarily mean every ticket that changed to solved during those 30 days.
The solved-by-agent sections also require a recent ticket update so they can represent recently active solved work. See Metric definitions for the exact interpretation of each value.
Admin and agent views
Section titled “Admin and agent views”Admins see organization-wide results. Agents see results scoped to tickets currently assigned to them.
Assignment is based on the ticket’s current assignee:
- If a ticket is reassigned, it moves into the new assignee’s reporting scope.
- A value grouped under an agent does not prove that agent authored the measured replies.
- A solved ticket grouped under an agent does not prove that agent personally changed its status to solved.
These reports describe the performance and state of assigned tickets, rather than maintaining authorship history for every action.
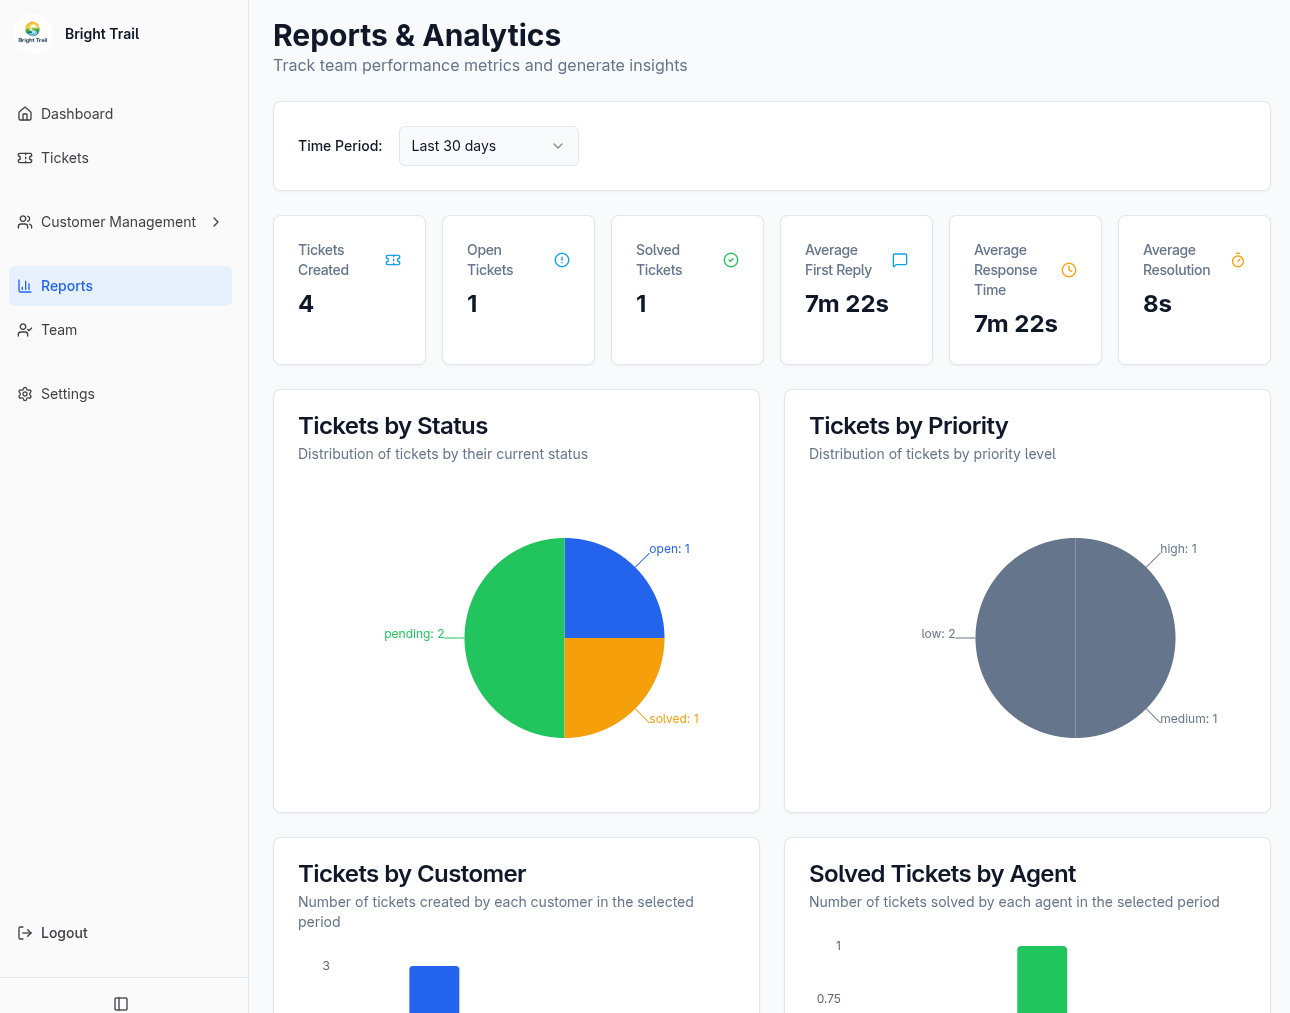
Summary cards
Section titled “Summary cards”The top of the Reports page shows:
- Tickets Created or Your Tickets: tickets created in the selected period. Agent results are limited to tickets currently assigned to that agent.
- Open Tickets or Your Open: selected tickets whose latest status is open.
- Solved Tickets or Your Solved: selected tickets whose latest status is solved.
- Average First Reply: the average first measured external staff reply time across selected tickets with that metric.
- Average Response Time: the average of the selected tickets’ own average reply times.
- Average Resolution: the average measured resolution time across selected tickets.
Tickets without a measured duration are excluded from duration averages. An unavailable value should be read as not measured, not as a zero-second reply or resolution.
Distribution charts
Section titled “Distribution charts”The report includes:
- Tickets by Status: selected tickets grouped by their latest status.
- Tickets by Priority: selected tickets grouped by their current priority.
- Tickets by Customer: selected tickets grouped by creator. In agent view, only tickets currently assigned to the agent are included.
These charts describe the latest version of tickets created in the selected period. A ticket can therefore move between groups after it is created.
Solved tickets by agent
Section titled “Solved tickets by agent”Admins can see solved tickets grouped by current assignee. This section uses solved tickets that were created within an extended lookback window and updated during the selected period.
Use it as an assigned-work view. It does not record who performed the solve action.
Agent performance comparison
Section titled “Agent performance comparison”The admin comparison combines:
- Solved tickets grouped by current assignee.
- Average first reply time for tickets currently assigned to each agent.
- Average response time for tickets currently assigned to each agent.
The reply columns describe the tickets in each agent’s current assignment scope. They are not author-level measurements of replies sent by that person.
Data freshness
Section titled “Data freshness”Reports are updated asynchronously. A recent ticket reply, status change, or reassignment may take a short time to appear. If a value has not changed immediately, wait briefly and refresh the report.